
Playwright Reports and Traces

Playwright will serve up a HTML report on your local server so you can easily walk through the steps of your test. You can also open a trace file which gives you even more powerful options of viewing, reporting, interacting and even debugging your tests.
If you are new to testing with Playwright, you might want to check out my previous post Getting Started with Playwright to get a better understanding of how Playwright works and how to easily get started with this amazing tool.
Serving the Html Report
You can see a full report of your tests by running the following command.
npx playwright show-report
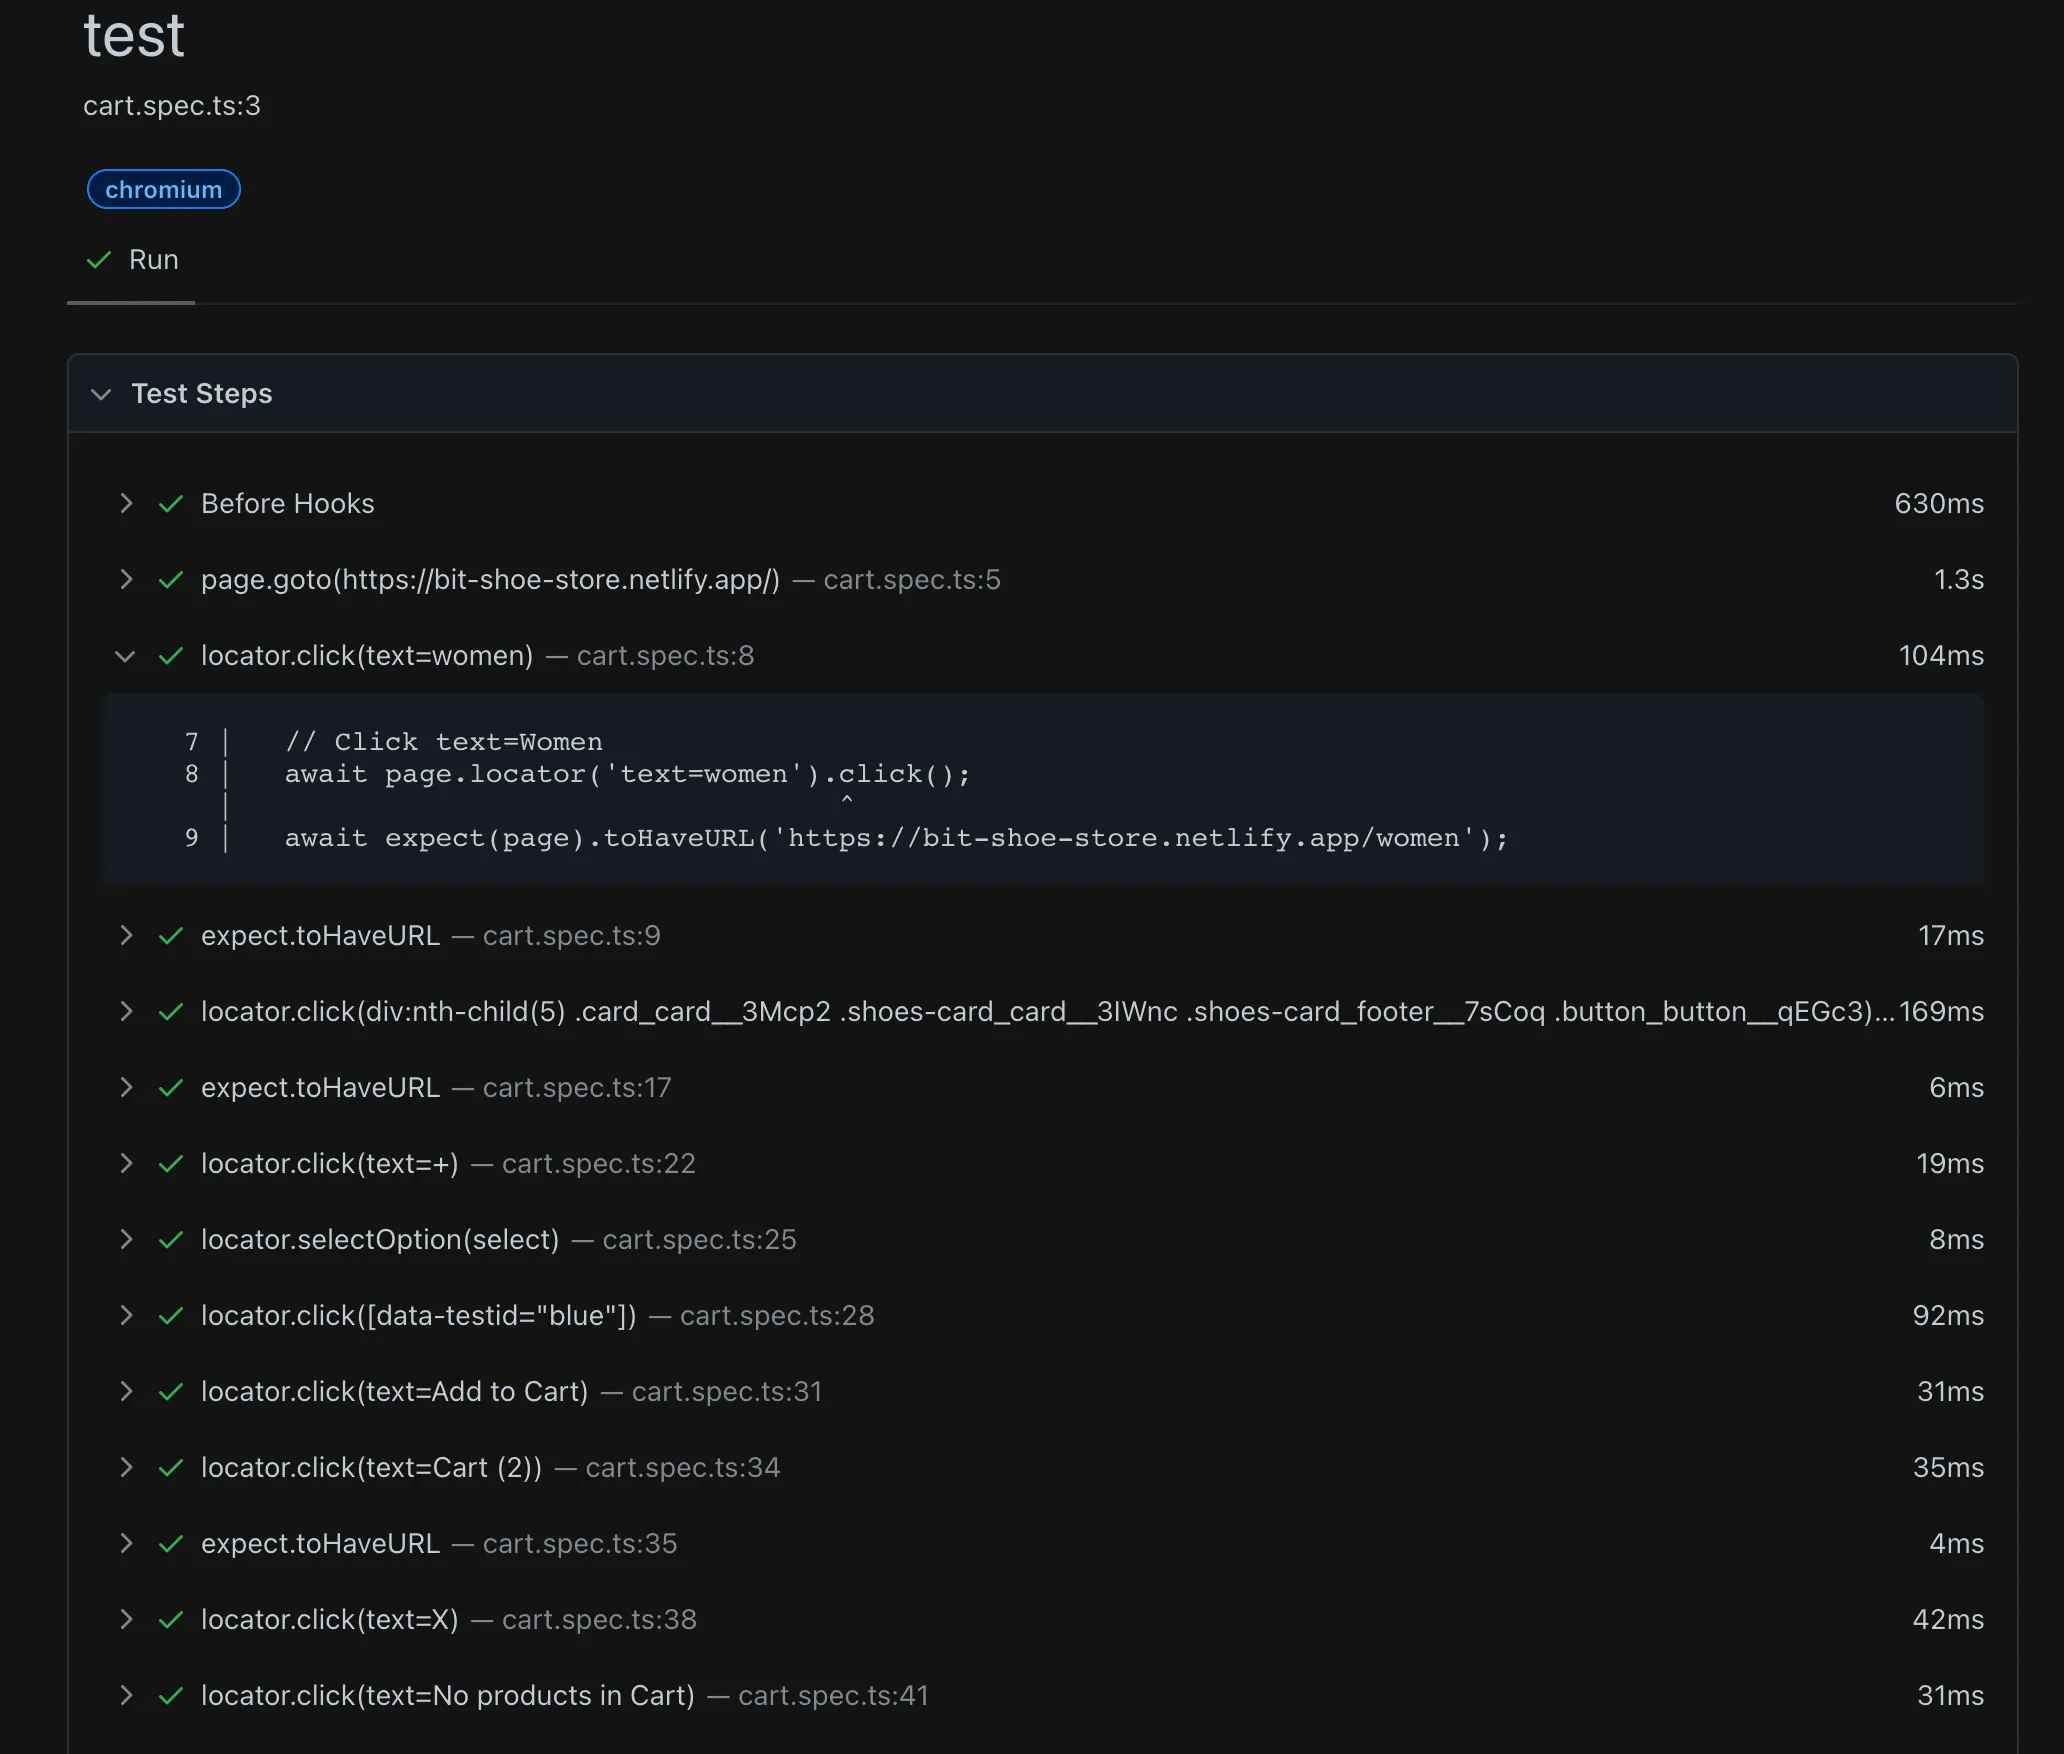
This will open up a browser window with a report of your tests. It will show you what browsers where used to run your tests, how long each test took and it will report each step of the test. The steps are collapsible meaning you can click on it and expand it to see the code ran for that particular part of the test.
Trace Viewer
This is one of my favourite features of Playwright. It allows you to view the trace file of your test and interact with it.
Setting the Trace in Playwright Config
To run the trace file you first need to modify the playwright.config.ts file. There are a few options listed below.
- 'off' - Do not record a trace
- 'on' - Record a trace for each test
- 'retain-on-failure' - Record a trace for each test, but remove it from successful test runs
- 'on-first-retry' - Record a trace only when retrying a test for the first time
For this example I have set the trace to 'on' so that I always get trace files for my tests.
const config: PlaywrightTestConfig = {
  ...
  use: {
    trace: 'on'
  }
  ...
}
export default config
Rerunning the Report
If you still have the html report open you can close it with Ctrl+C. We now need to create a new report which contains the trace file.
npx playwright show-report
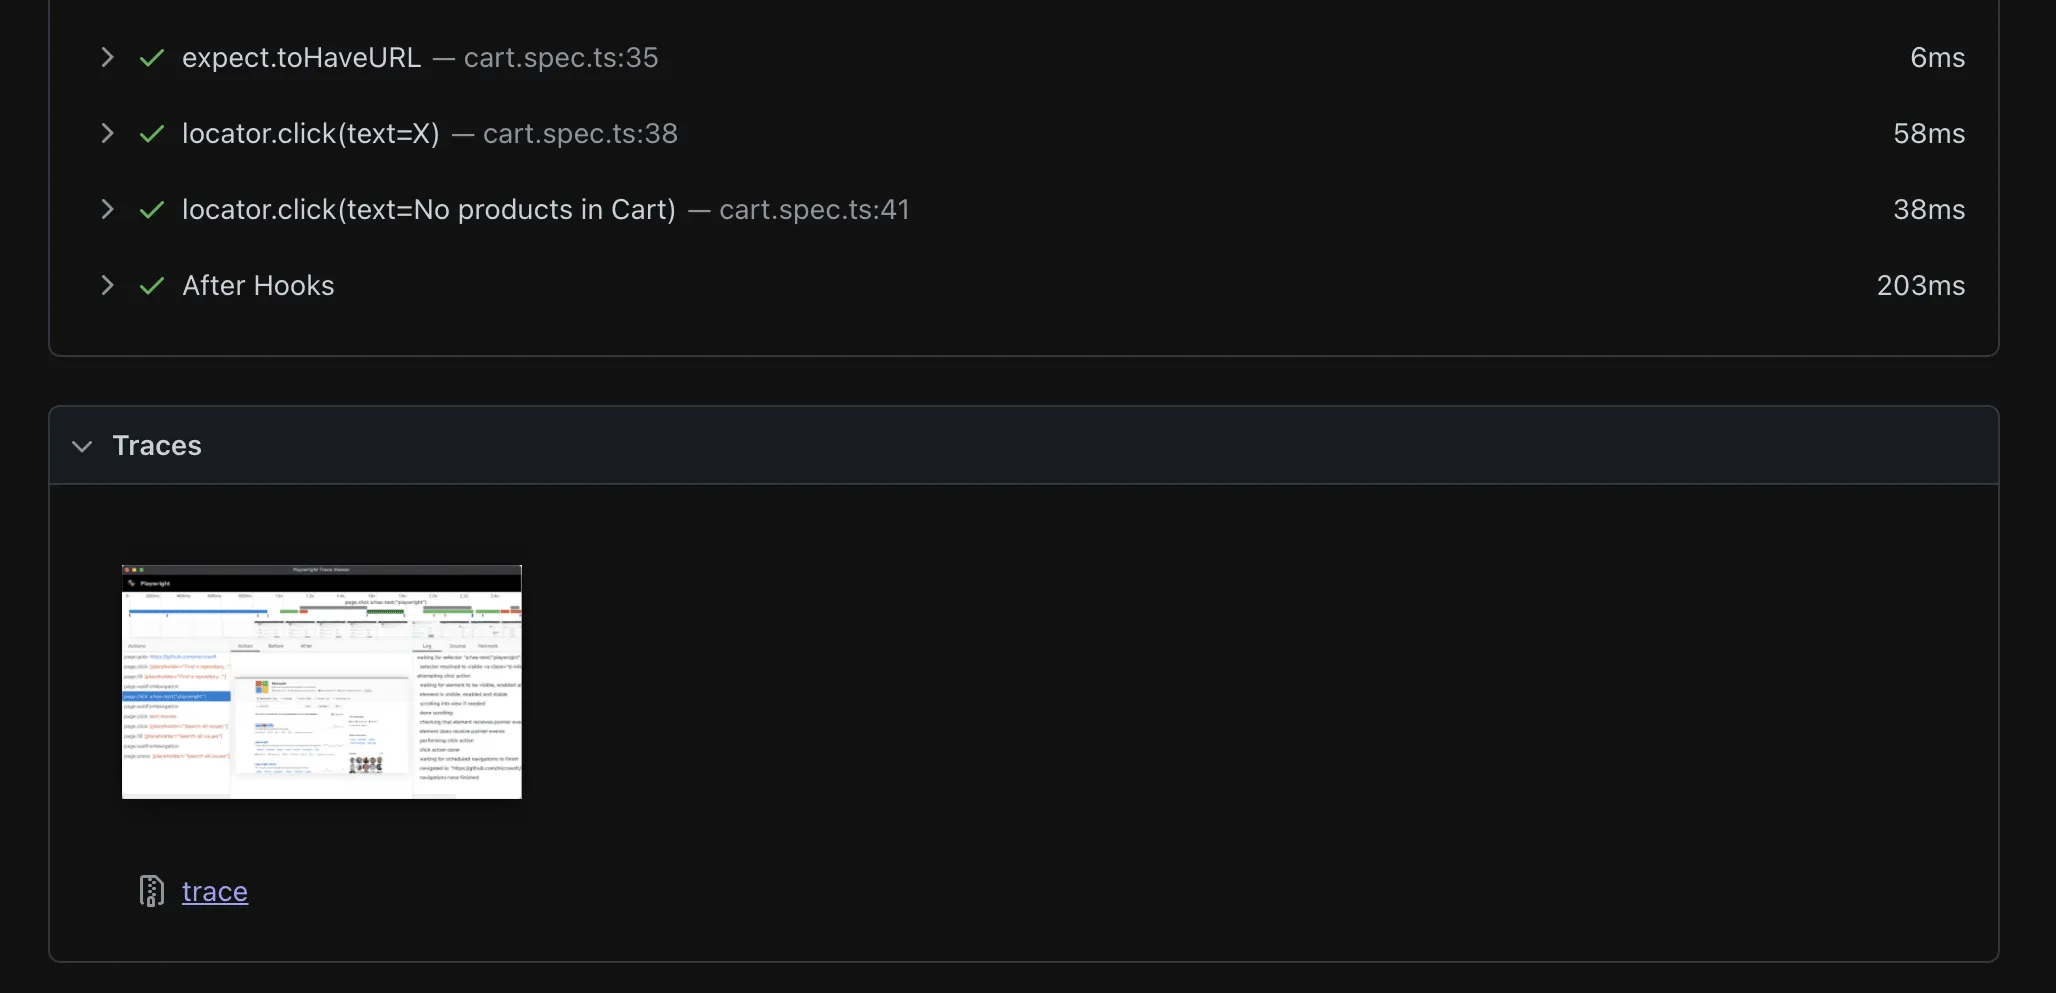
Just like before the html report will open for you with a report of your test. But now at the very bottom you will see a Trace section with an image and a link to your trace. Clicking this link will open up your trace.
Viewing the Trace File
Once you have clicked on the trace link you will see a new browser window with your test' trace. This is a locally hosted PWA where you can play around with your test trace.
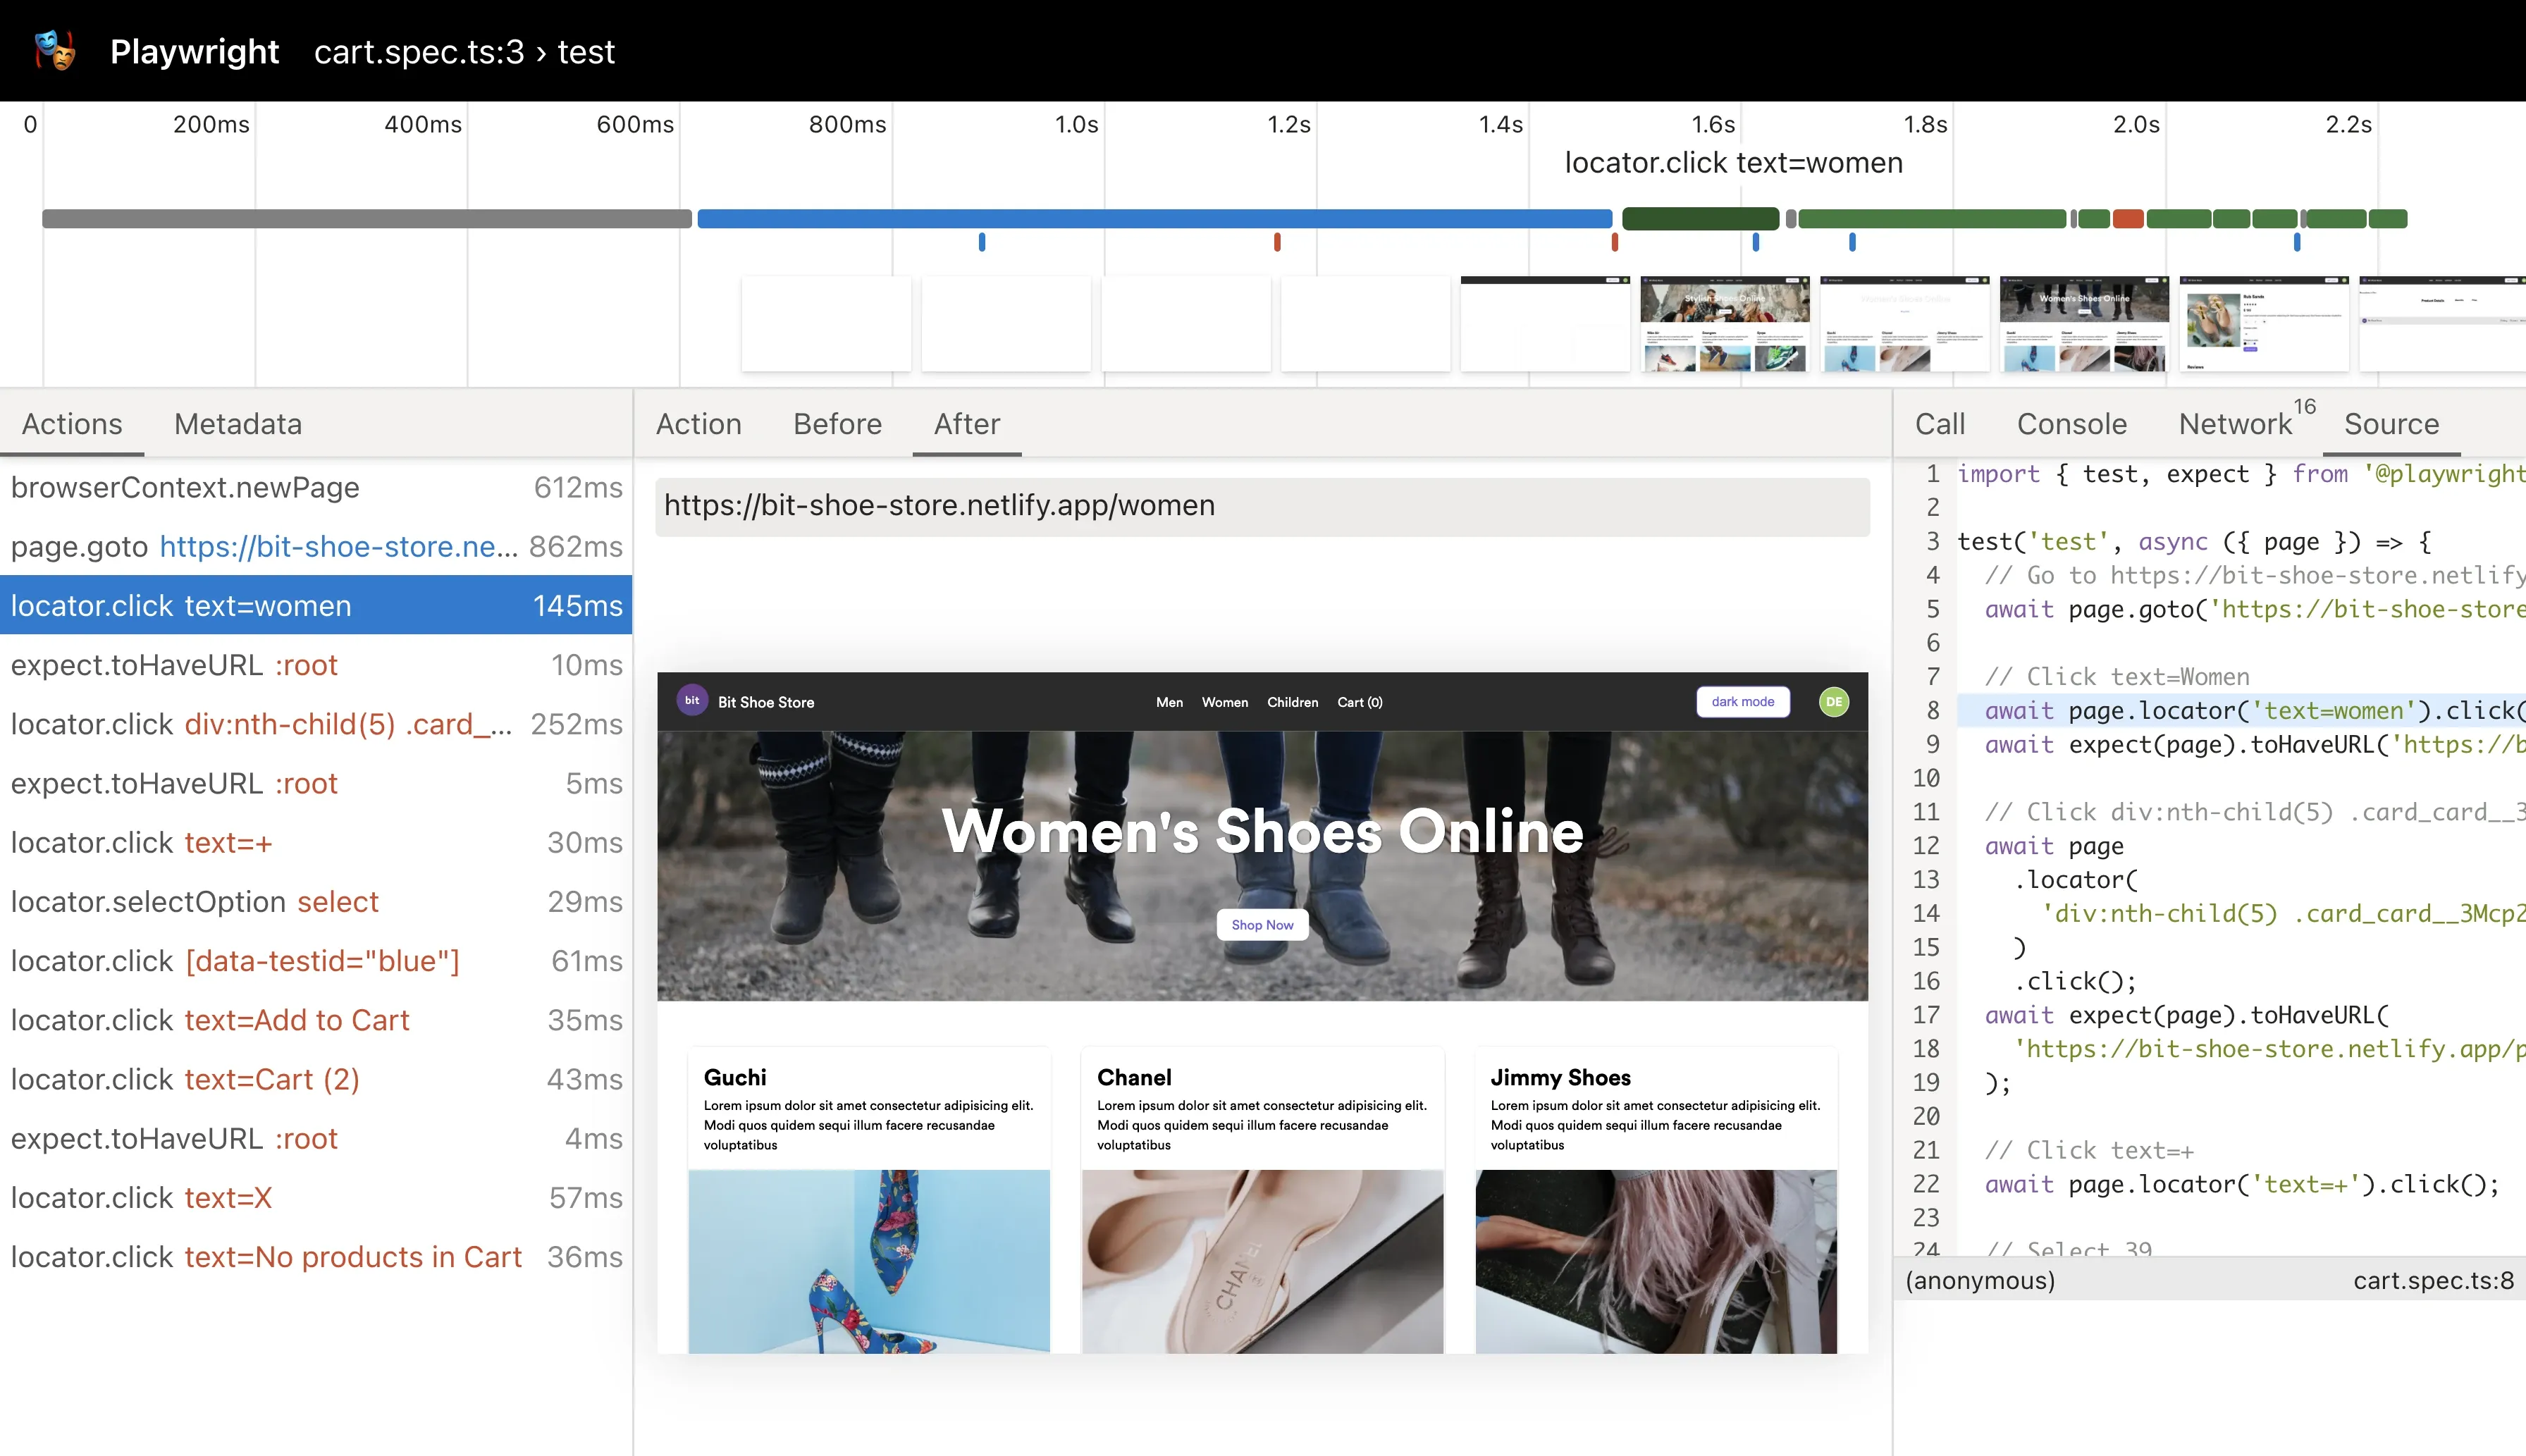
At the top is the timeline where you can scroll across and see your page at different states depending on the action. Each action has a different color such as green for clicks and red for selects.
On the left had side is the actions and Metadata where you can see each action of your test. When you click on an action you will then see the outcome of that action in the middle part.
The middle part shows a DOM snapshot of your site with the action highlighted. The before tab shows you what the page was like before the action and the after tab shows you what the page looks like after the action has been clicked.
On the right hand side you can see the call for this action showing what the selector was, if it is in strict mode etc, the console log incase there are any console messages or errors, the network to see all network requests and the source for the tests.
Check out the video to see it in action.
Inspecting the DOM Snapshot
The really cool thing about this is that the snapshot of your site in the middle is actually a DOM snapshot meaning it is fully interactive. You can scroll it, click user events and even open the browser dev tools inside this dev tool. Very cool.
Conclusion
The trace viewer is a really cool way of going through your tests and inspecting them further. This is served as a PWA on your local host and therefore is completely safe as all your data is only on your machine.
There is so much more cool things you can do with Playwright and I highly encourage you to check it out especially is it is open source and therefore free to use. Take it for a spin. Have fun and let's get testing!